Waves & Water Levels
Live Camera
Beach Surveys
Hindcast & Forecast
Drone Surveys
More Data
Visualizing Beach Changes: Videos and Images
Explore the dynamic changes occurring along our coastlines through captivating images captured by our Coastal Monitoring Cameras. These visual records offer a unique perspective on the natural processes shaping our beaches, revealing the impact of tides, weather, and human activity over time. Dive into this visual journey to better understand the delicate balance of our coastal ecosystems and the importance of ongoing monitoring and preservation efforts.
Other Coastal Data
Discover more geospatial coastal data available from the Council, including coastal LiDAR surveys, coastal imagery, and pre- and post-storm Gabrielle surveys. For more geospatial data, please check: Auckland Council Open Data or explore other environmental monitoring data at the Environment Auckland Data Portal.
Coastal Hazard Tools
Explore a range of coastal hazard tools, including sea level rise projections, tsunami evacuation zones, and coastal inundation maps among others. For more geospatial data, please check: Auckland Council Open Data or explore other environmental monitoring data at the Environment Auckland Data Portal.
External Resources
Explore coastal data from Auckland and across New Zealand, developed and made publicly available by researchers using techniques like satellite imagery and historical photos, to enhance our understanding of changes occurring along our coastlines.
Auckland Marine Hindcast & Forecast
In 2024, the Coastal Process Monitoring (CPM) Programme within EEMU in collaboration with Oceanum Ltd implemented advanced hydrodynamic and wave models, validated with in situ instrumentation, to meet Auckland Council's specific needs. These models provide high temporal and spatial resolution, delivering precise insights into the region's marine conditions.
The system supports both hindcast and forecast capabilities, offering a complete picture of past and future coastal dynamics to inform decision-making and coastal management strategies.
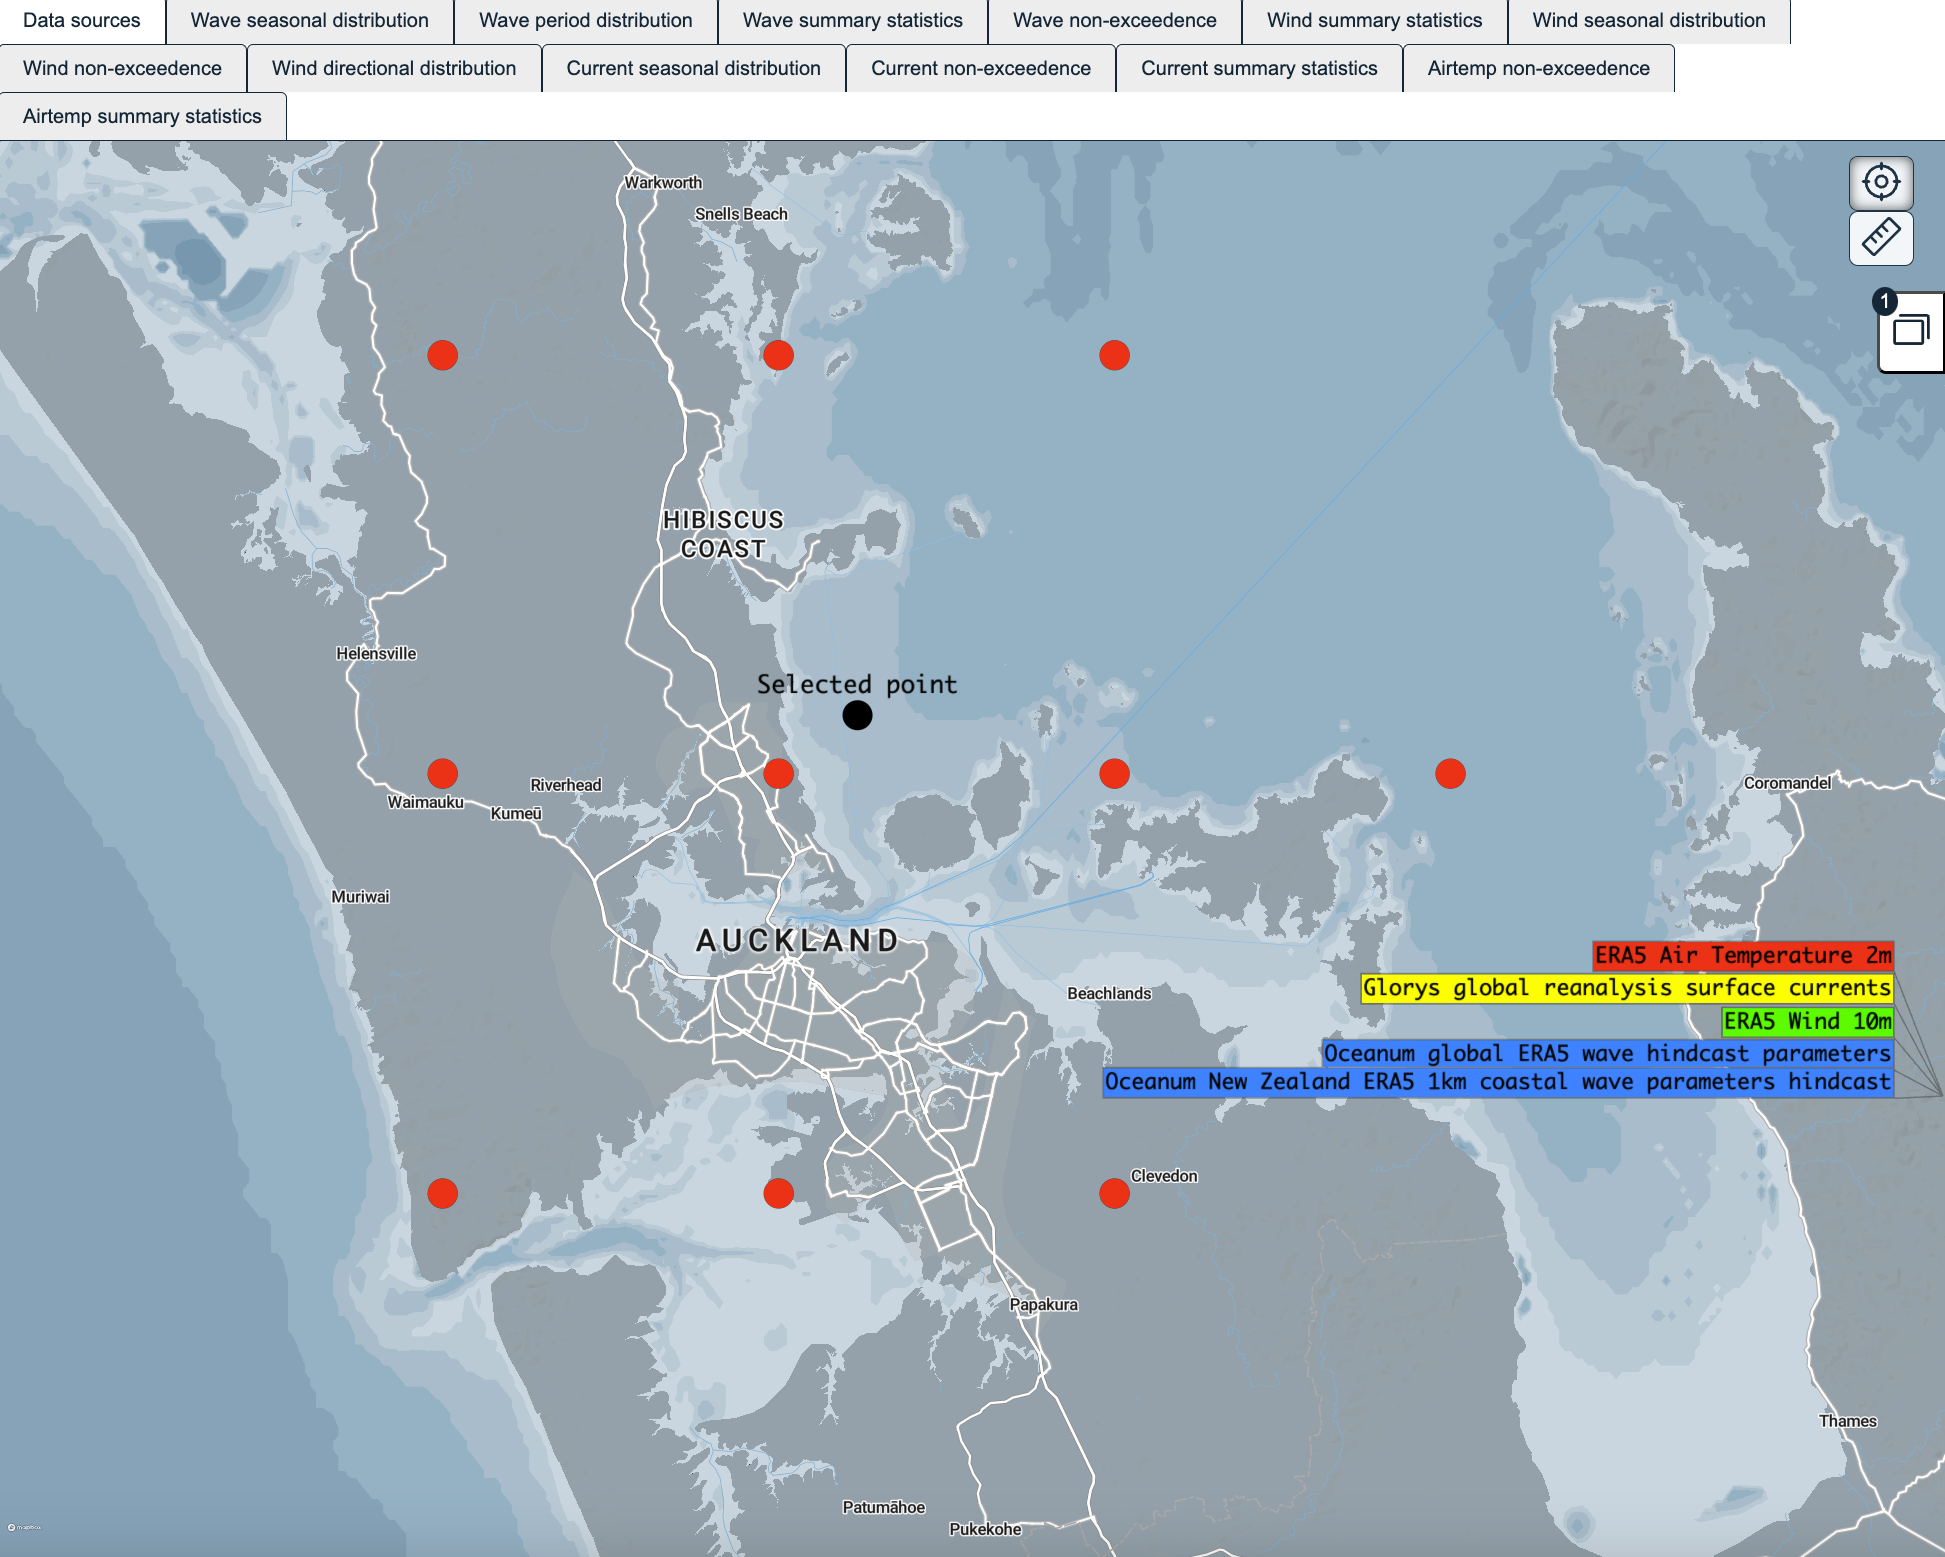
Marine Hindcast
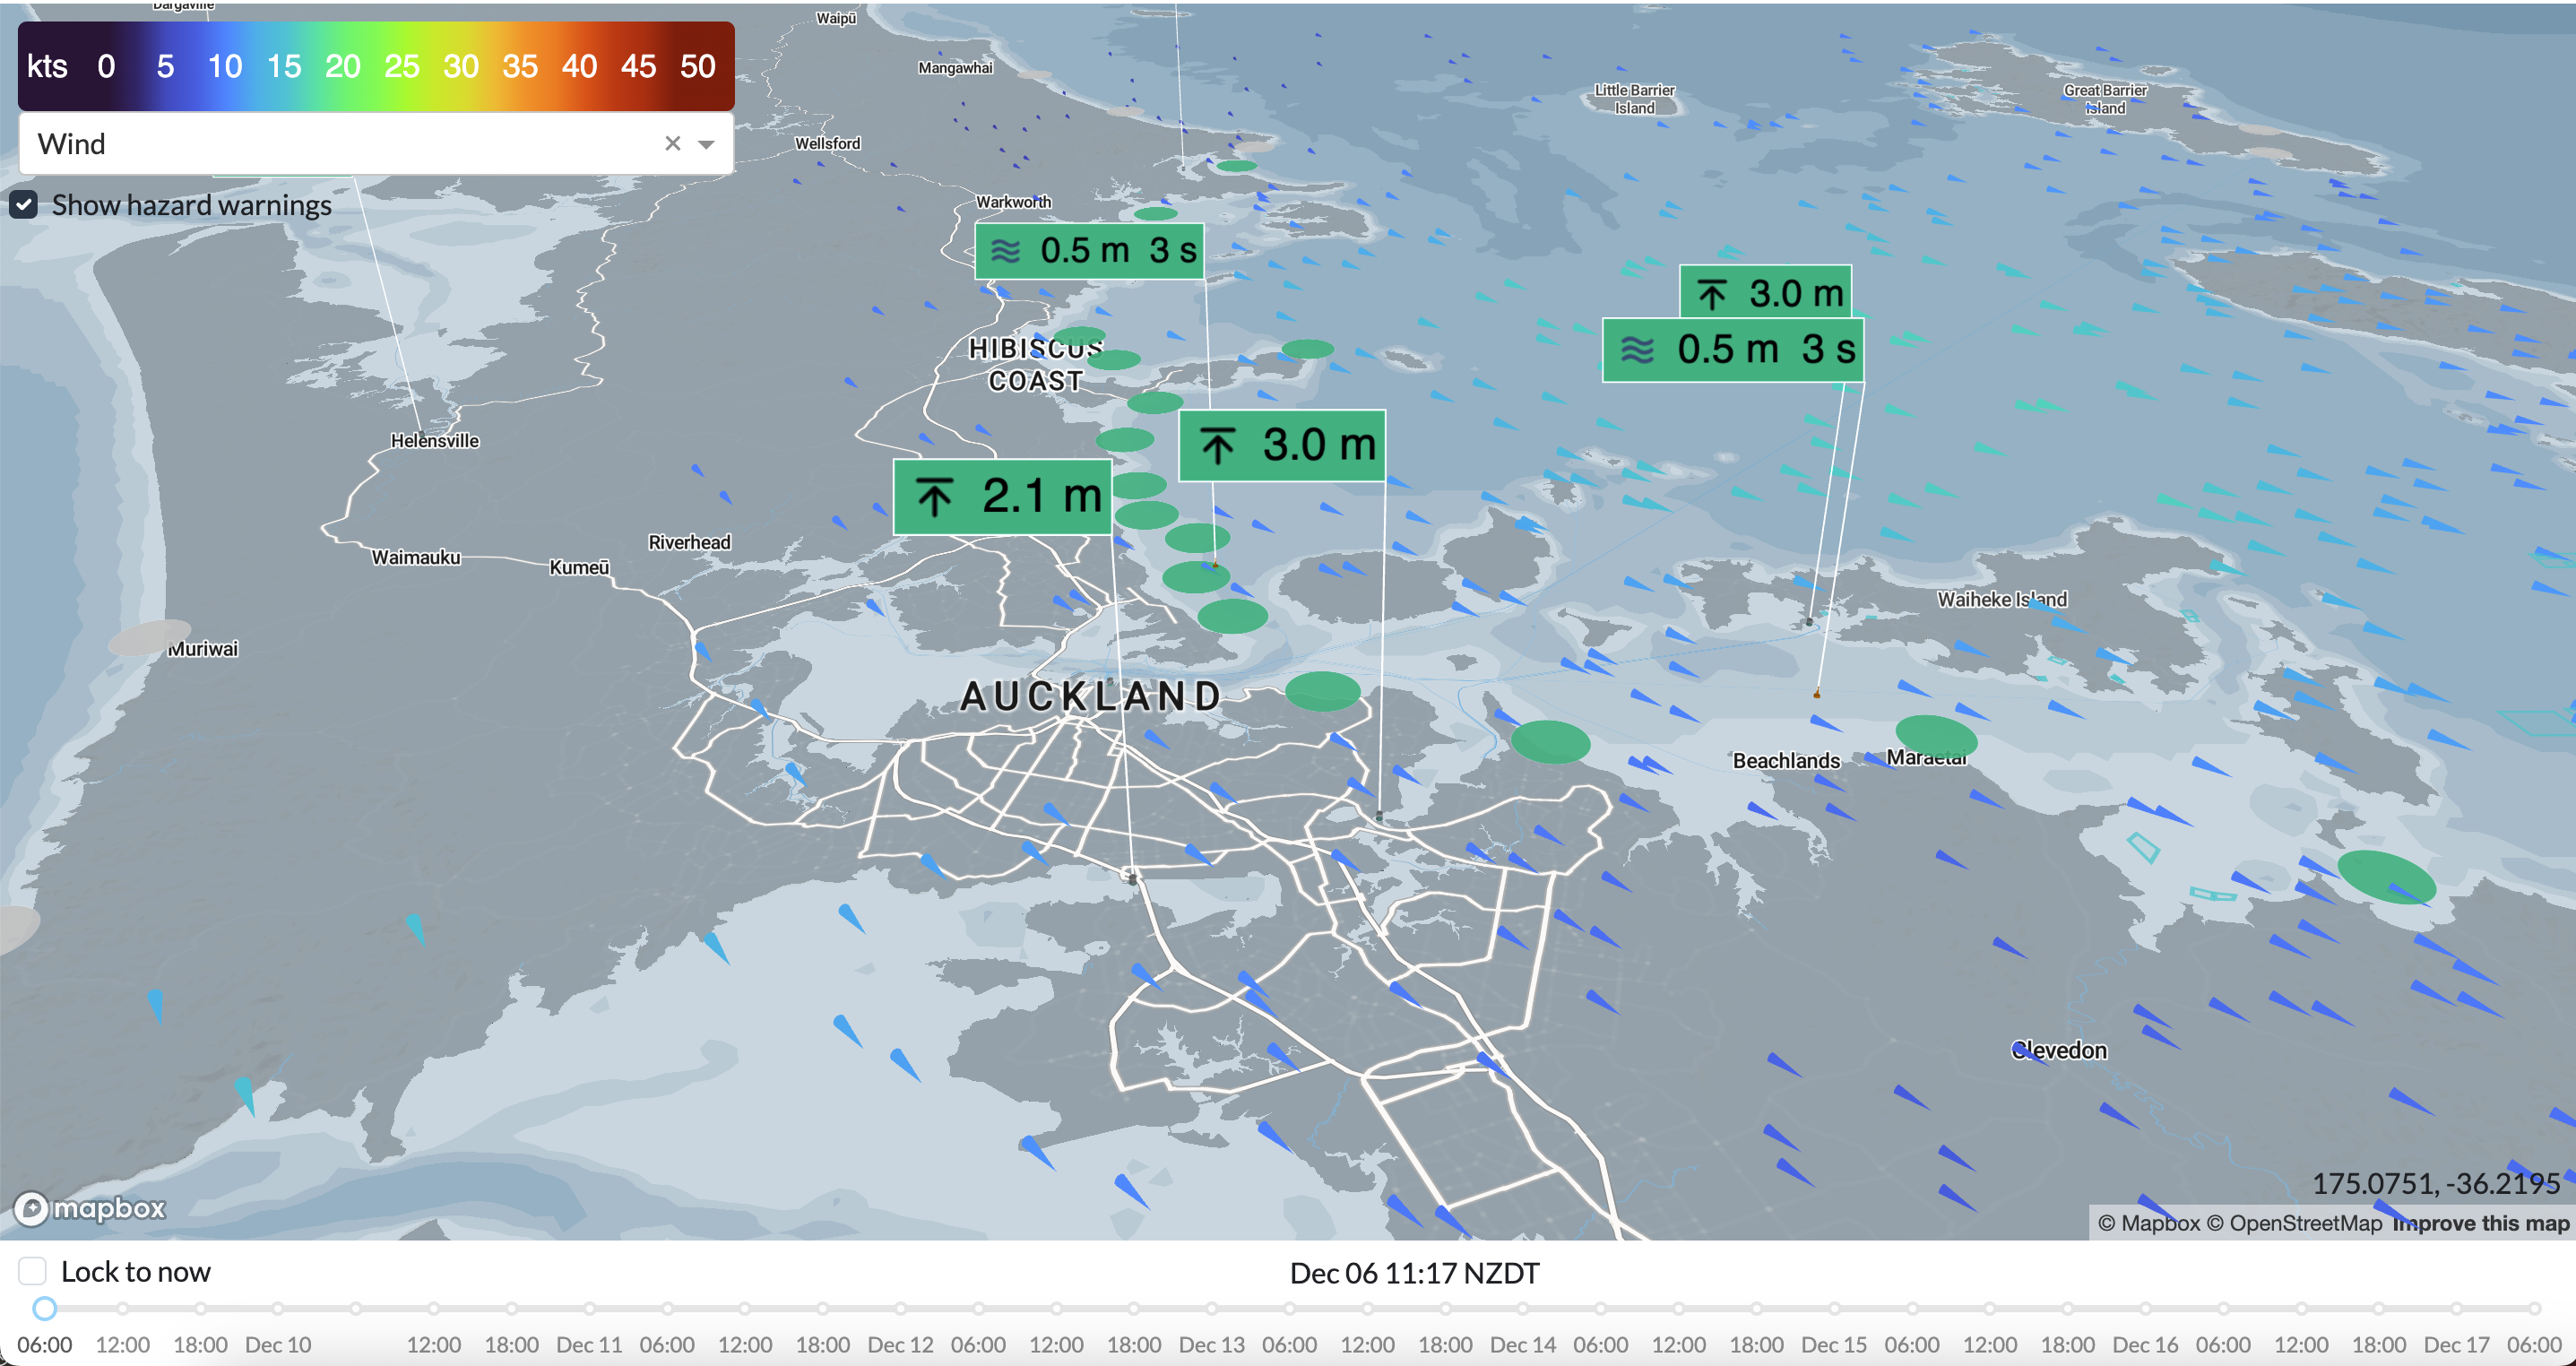
Marine Forecast
The hindcast dataset spans several decades, offering a detailed historical record of oceanographic conditions, including waves, winds, and atmospheric data. This long-term information is critical for analyzing trends in coastal storm frequency and intensity, enabling robust coastal management strategies. It helps interpret historical patterns, assess beach behavior, and predict future coastal vulnerability.
The forecast system provides high-resolution, hourly projections for waves, winds, tides, storm surges, and currents up to seven days ahead. Integrated with real-time measurements from buoys and tide gauges, it ensures continuous validation and accuracy. Updates every six hours incorporate the latest meteorological and oceanographic data. A dynamic map highlights areas at risk, while automated email alerts notify users of potential hazards, facilitating proactive risk management.
The top figure displays historical changes in beach width, defined
as the distance between a benchmark and a specified contour
elevation. This provides insights into the squeezing (low beach
width values) or growth (large beach width values) of the beach over
time.
Click on a dot (representing a date) to view the corresponding
beach profile for that day. Up to six beach profiles can be
displayed simultaneously in the lower panel.
To access historical beach profiles, please
contact us. and for a better understanding of the beach parameters shown in
these figures, visit the
About page
and click on "Beach Parameters Explanation."
Active wave buoys send wave parameters every 30 minutes. You can
view data from active wave buoys for the past three months. The
entire record of inactive wave buoys can be viewed by clicking on
the buoy icon. Additionally, tide gauge measurements are also
available. If you need additional data, please
contact us.
For a better understanding of wave parameters, visit the
About page
and click on the wave parameters explanation.
Check out the last 24-hour time-lapse or the 7-day forecast for wind, waves, currents, and water levels. For more details, visit the About page. Before heading to the beach, check Safeswim for the latest water quality and swimming conditions.